Coal dust – which may be a component of urban dust – is of concern to many communities, particularly those near coal mines, railroads and ports. To reduce dust concentrations, we need to first understand where the particulates originate from by characterising the particles that comprise the dust. This should be done in a way that is acceptable to community groups, residents and experts, to result in evidence-based policy.
Why do we need to investigate urban dust?
Communities, industry, government and academic bodies, and politicians are concerned about the health effects of urban dust. To create effective policies to reduce dust concentrations in the air, the amount, composition and size distribution of the particles in urban dust need to be characterised consistently and accurately.
Coal dust is fine, powdered coal, formed when coal is crushed or pulverised during mining and transportation. Coal dust can sometimes be a component of urban dust, which may also contain soot, dirt, metal, paint, and insect and plant detritus. Coal dust is an issue of community concern, particularly associated with the handling of coal on railways and ports in urban environments.
Urban dust samples can be qualitatively and quantitatively characterised using chemical and microscopic methods. This article looks at reflected light microscopy methods – the manual point counting method and the automated imaging analysis method. These methods can distinguish carbon-based particles, such as rubber, organic material and diesel soot, in addition to coal particles.
How can we characterise urban dust samples?
The collected dust sample is mixed with a polyester resin and allowed to cure; the set block is then cut and polished to a mirror finish. When prepared this way, the samples can be studied using a high magnification (500×) so that the different urban dust particles can be identified visually by an expert petrographer. Dust particles can also be characterised by their reflectance histogram using an imaging system.
Manual point counting method
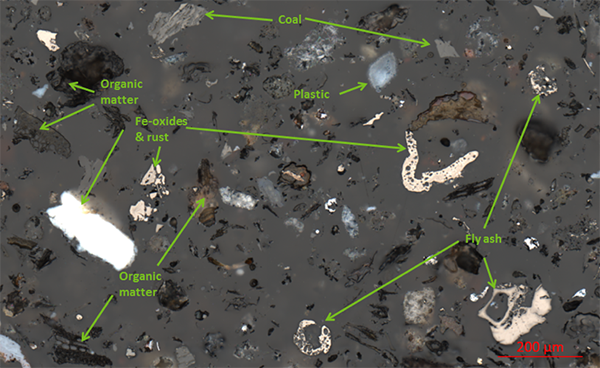
The manual point counting method requires a petrographer to manually identify different components of an urban dust sample under a microscope (see Figure 1), using the Diessel classification method.1 The manual point counting method needs an extremely skilled operator to correctly identify the particles.
For this article, the manual point counting method was used to characterise a sample collected from a rooftop near the coal port in Gladstone, Queensland.
Reflected light imaging analysis method (coal grain analysis)
Coal grain analysis (CGA) uses image processing software that combines high-resolution colour images derived from optical reflected light microscopy. The software creates a reflectance histogram, or fingerprint, for each individual particle in the image of each sample. The fingerprint is then used to differentiate the coal and non-coal particles.
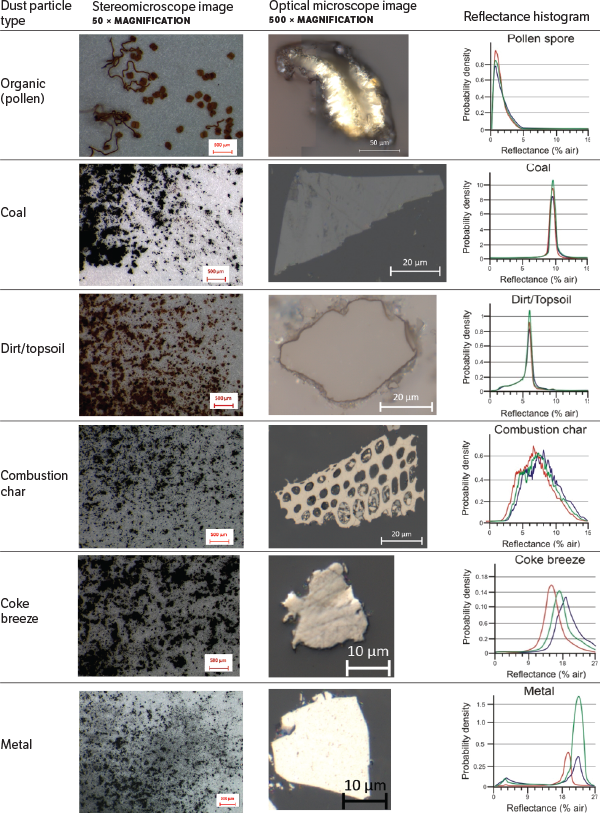
CSIRO prepared a reference library of about 30 different types of particulates that could be found in urban dust, including coal particles. A subset of the particulates in this reference library (Figure 2) shows the different appearances of the different types of particles, which serve as reference points for different urban dust samples. Additional work done at the Australian Synchrotron verified this method, and showed that samples that appeared different did indeed have different chemical compositions.
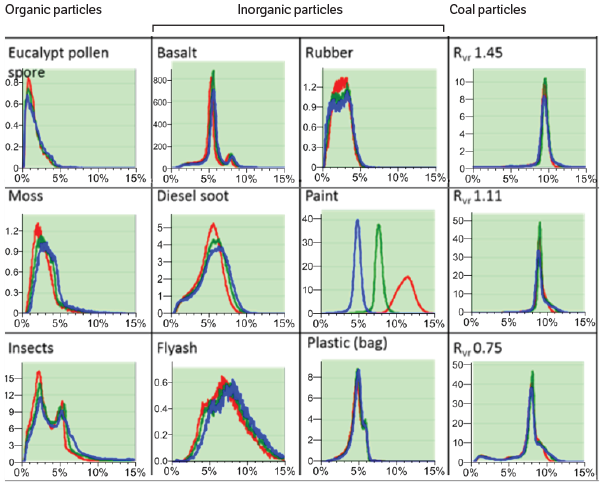
The verification step was automated by creating reflectance fingerprints from the CSIRO known reference samples (see Figure 3). After the software classifies each particle in the image, a skilled petrographer then validates the characterisation of each particle. The Australian Coal Association Research Program is funding work to develop ‘optical dust markers’ that use the reflectance fingerprints of the samples in the CSIRO reference library to speed up and improve this validation step.
CGA was used to analyse 49 samples from 5 different locations in the Mackay region in Queensland, and an additional 19 samples from Newcastle, New South Wales.
Results of the urban dust characterisations
The manual point counting method found that one of the Queensland dust samples contained coal from a range of sources consistent with the known vitrinite reflectance fingerprints of the coals shipped through the Gladstone port. Vitrinite is one of the primary components of coal.
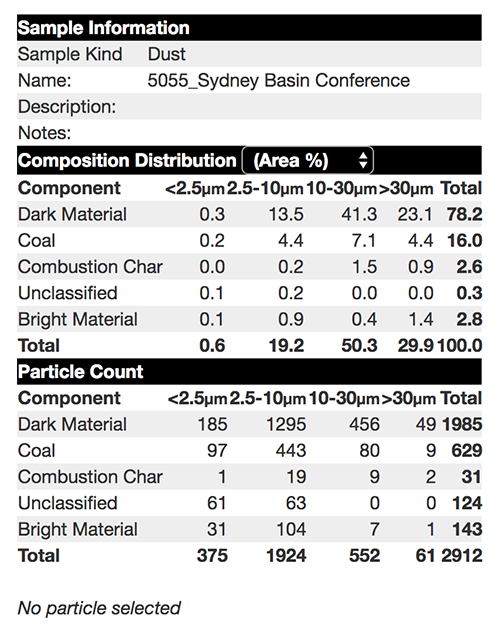
In one of the Newcastle samples, CGA identified size and composition information for 2912 individual particles (Box 1). The sample was found to contain particles of clays, quartz and organic material; iron particles; and small amounts of soot and rubber.
Box 1 CSIRO software to characterise dust samples
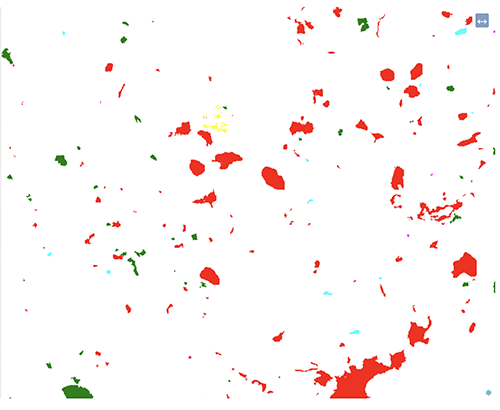
CSIRO has developed specialised software that identifies the composition of dust samples and the amount of different particle types in the sample. Researchers can upload images from the CGA to a website. Figure 4 shows results for the Newcastle sample:
- dark material particles (predominately dirt, sand, rubber, some plastic and paint, and organic material) are shown as red
- coal particles are shown as dark green
- combustion biochar particles are shown as yellow
- unclassified particles are shown as pink
- bright material (predominately iron flakes, and some plastics and paint) are shown in light blue.
Why do we need two different characterisation methods?
Information from the manual point counting method and the reflected light imaging analysis method can be used side by side to complement each other. The advantage of the manual analysis is that a skilled petrographer can identify more of the non-coal particulates than can currently be identified by an imaging system. They can also use vitrinite reflectance information to determine the possible origin of the coal. However, an imaging analysis method, such as CGA, can characterise far more particulates in a sample than a manual method. Imaging analysis methods can provide particle size information for every particle greater than 1 micron.
Therefore, combining the methods will provide a more quantitative analysis.
This article was based on:
- O’Brien G, Warren K, Koval S and Hibberd M (2017). Quantifying coal dust in urban samples. In: Proceedings of the 40th Symposium on Advances in the Study of the Sydney Basin: weathering change, Pokolbin, New South Wales, 27–28 April 2017.
- Koval S, Krahenbuhl G, Warren K, O’Brien G (2017). Optical microscopy as a new approach for characterising dust particulates in urban environment. J Environ Manage 223:196–202.
References
- Diessel C (1999). Particulate UFOs and IFOs in Newcastle air. In: C Diessel, EK Swift and S Francis (eds), Proceedings of the 33rd Newcastle Symposium on Advances in the Study of the Sydney Basin, Newcastle, New South Wales, 30 July – 1 August 1999.